NEWS
- KHI SỰ TINH GIẢN LÀ ĐỈNH CAO CỦA CÔNG NGHỆ BÁN HÀNG 2026 - PHẦN MỀM BÁN HÀNG BASYS
- Phần mềm bán hàng cho hộ kinh doanh BASYS đơn giản ít thao tác
- [C#] Hướng dẫn tích hợp thêm menu vào System menu của ứng dụng
- [DEVEXPRESS] Hỗ trợ tìm kiếm highlight không dấu và không khoảng cách trên Gridview Filter
- [C#] Chia sẻ source code phần mềm Image Downloader tải hàng loạt hình ảnh từ danh sách link url
- [C#] Chụp hình và quay video từ camera trên winform
- [C#] Chia sẽ full source code tách file Pdf thành nhiều file với các tùy chọn
- Giới thiệu về Stock Tracker Widget - Công cụ theo dõi cổ phiếu và cảnh báo giá tăng giảm bằng C# và WPF
- [VB.NET] Chia sẻ công cụ nhập số tiền tự động định dạng tiền tệ Việt Nam
- [VB.NET] Hướng dẫn fill dữ liệu từ winform vào Microsoft word
- [VB.NET] Hướng dẫn chọn nhiều dòng trên Datagridview
- Hướng Dẫn Đăng Nhập Nhiều Tài Khoản Zalo Trên Máy Tính Cực Kỳ Đơn Giản
- [C#] Chia sẻ source code phần mềm đếm số trang tập tin file PDF
- [C#] Cách Sử Dụng DeviceId trong C# Để Tạo Khóa Cho Ứng Dụng
- [SQLSERVER] Loại bỏ Restricted User trên database MSSQL
- [C#] Hướng dẫn tạo mã QRcode Style trên winform
- [C#] Hướng dẫn sử dụng temp mail service api trên winform
- [C#] Hướng dẫn tạo mã thanh toán VietQR Pay không sử dụng API trên winform
- [C#] Hướng Dẫn Tạo Windows Service Đơn Giản Bằng Topshelf
- [C#] Chia sẻ source code đọc dữ liệu từ Google Sheet trên winform
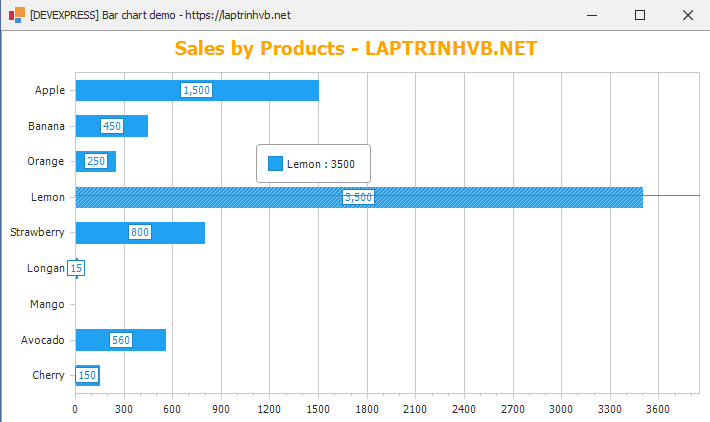
[DEVEXPRESS] Hướng dẫn vẽ biểu đồ Bar Chart trên Winform
Đăng bởi: Thảo Meo - Lượt xem: 5755
Xin chào các bạn, bài viết hôm nay mình hướng dẫn các bạn vẽ biểu đồ Bar Chart của ChartControl trên Devexpress Winform C#.
[DEVEXPRESS] Vẽ biểu đồ Bar Chart trên winform C#
Dưới đây, là hình ảnh demo ứng dụng:
Source code C#:
using DevExpress.XtraCharts;
using DevExpress.XtraCharts.Native;
using System;
using System.Collections.Generic;
using System.ComponentModel;
using System.Data;
using System.Drawing;
using System.Linq;
using System.Text;
using System.Windows.Forms;

namespace BarChartDemo
{
    public partial class Form1 : DevExpress.XtraEditors.XtraForm
    {
        public Form1()
        {
            InitializeComponent();
        }

        class DataDemo
        {
            public string name { get; set; }
            public int value { get; set; }
        }

        protected override void OnLoad(EventArgs e)
        {
            base.OnLoad(e);

            var listData = new List<DataDemo>();
            listData.Add(new DataDemo() { name = "Apple", value = 1500});
            listData.Add(new DataDemo() { name = "Banana", value = 450});
            listData.Add(new DataDemo() { name = "Orange", value = 250});
            listData.Add(new DataDemo() { name = "Lemon", value = 3500});
            listData.Add(new DataDemo() { name = "Strawberry", value = 800});
            listData.Add(new DataDemo() { name = "Longan", value = 15});
            listData.Add(new DataDemo() { name = "Mango", value = 0});
            listData.Add(new DataDemo() { name = "Avocado", value = 560});
            listData.Add(new DataDemo() { name = "Cherry", value = 150});

            chartControl1.DataSource = listData;

            Series series1 = new Series("fruit", ViewType.StackedBar);
            series1.ArgumentDataMember = "name";
            series1.ValueDataMembers.AddRange("value");
            series1.LabelsVisibility = DevExpress.Utils.DefaultBoolean.True;
            series1.Label.TextPattern = "{V:#,###.##}";
            series1.View.Color = ColorTranslator.FromHtml("#21A1F1");
            series1.Label.TextAlignment = StringAlignment.Far;


            chartControl1.Series.AddRange(new Series[] { series1 });
            var label = chartControl1.Series[0].Label as SideBySideBarSeriesLabel;
            if (label != null)
            {
                label.Position = BarSeriesLabelPosition.Top;
            }

            ((XYDiagram)chartControl1.Diagram).Rotated = true;
            ((XYDiagram)chartControl1.Diagram).AxisX.Tickmarks.MinorVisible = false;
            ((XYDiagram)chartControl1.Diagram).AxisX.Reverse = true;
            // Disable minor tickmarks on the x-axis:
            XYDiagram diagram = (XYDiagram)chartControl1.Diagram;
            diagram.AxisX.Tickmarks.MinorVisible = false;
            diagram.AxisX.Label.TextPattern = "{V:#,###.##}";
            chartControl1.Titles.Add(new ChartTitle { Text = "Sales by Products - LAPTRINHVB.NET", DXFont = new Font("Tahoma", 14, FontStyle.Bold), TextColor=Color.Orange });
            chartControl1.Legend.Visibility = DevExpress.Utils.DefaultBoolean.False;
            chartControl1.Legend.MarkerMode = LegendMarkerMode.None;
            chartControl1.Legend.AlignmentHorizontal = LegendAlignmentHorizontal.Center;
            chartControl1.Legend.AlignmentVertical = LegendAlignmentVertical.BottomOutside;
            chartControl1.Legend.Direction = LegendDirection.LeftToRight;

        }
    }
}
Các bạn chỉ cần thay thông tin database mẫu bằng truy vấn cơ sở dữ liệu để hiển thị là xong.
Thanks for watching!
THÔNG TIN TÁC GIẢ
NGUYỄN THẢO
Youtube Channel: https://www.youtube.com/@thaomeotv

BÀI VIẾT LIÊN QUAN
Đăng bởi: Thảo Meo - Lượt xem: 5755