NEWS
- KHI SỰ TINH GIẢN LÀ ĐỈNH CAO CỦA CÔNG NGHỆ BÁN HÀNG 2026 - PHẦN MỀM BÁN HÀNG BASYS
- Phần mềm bán hàng cho hộ kinh doanh BASYS đơn giản ít thao tác
- [C#] Hướng dẫn tích hợp thêm menu vào System menu của ứng dụng
- [DEVEXPRESS] Hỗ trợ tìm kiếm highlight không dấu và không khoảng cách trên Gridview Filter
- [C#] Chia sẻ source code phần mềm Image Downloader tải hàng loạt hình ảnh từ danh sách link url
- [C#] Chụp hình và quay video từ camera trên winform
- [C#] Chia sẽ full source code tách file Pdf thành nhiều file với các tùy chọn
- Giới thiệu về Stock Tracker Widget - Công cụ theo dõi cổ phiếu và cảnh báo giá tăng giảm bằng C# và WPF
- [VB.NET] Chia sẻ công cụ nhập số tiền tự động định dạng tiền tệ Việt Nam
- [VB.NET] Hướng dẫn fill dữ liệu từ winform vào Microsoft word
- [VB.NET] Hướng dẫn chọn nhiều dòng trên Datagridview
- Hướng Dẫn Đăng Nhập Nhiều Tài Khoản Zalo Trên Máy Tính Cực Kỳ Đơn Giản
- [C#] Chia sẻ source code phần mềm đếm số trang tập tin file PDF
- [C#] Cách Sử Dụng DeviceId trong C# Để Tạo Khóa Cho Ứng Dụng
- [SQLSERVER] Loại bỏ Restricted User trên database MSSQL
- [C#] Hướng dẫn tạo mã QRcode Style trên winform
- [C#] Hướng dẫn sử dụng temp mail service api trên winform
- [C#] Hướng dẫn tạo mã thanh toán VietQR Pay không sử dụng API trên winform
- [C#] Hướng Dẫn Tạo Windows Service Đơn Giản Bằng Topshelf
- [C#] Chia sẻ source code đọc dữ liệu từ Google Sheet trên winform
[C#] Hướng dẫn vẽ biểu đồ cột xuất file excel sử dụng thư viện Epplus
Đăng bởi: Thảo Meo - Lượt xem: 7606
Xin chào các bạn, bài viết hôm nay mình sẻ tiếp tục hướng dẫn các bạn cách vẽ biểu đồ trên file Excel sử dụng thư viện Epplus C# Winform.
[C#] Export data to Excel file with chart Winform
Biểu đồ là một trong những thành phần không thể thiếu trong các báo cáo.
Khi nhìn các số liệu được biểu diễn trên biểu đồ chúng ta thấy trực quan và dễ hiểu hơn nhiều so với nhìn vào các con số trong bảng báo cáo.
Ví dụ: chúng ta có dữ liệu đất đai như hình bên dưới
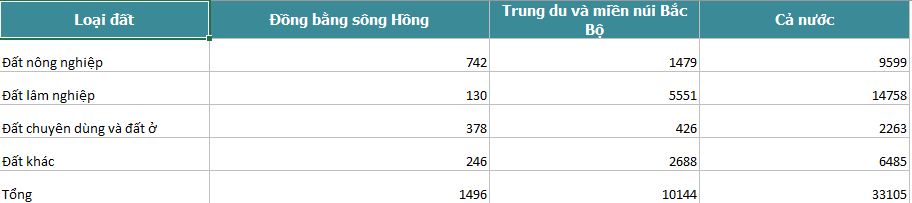
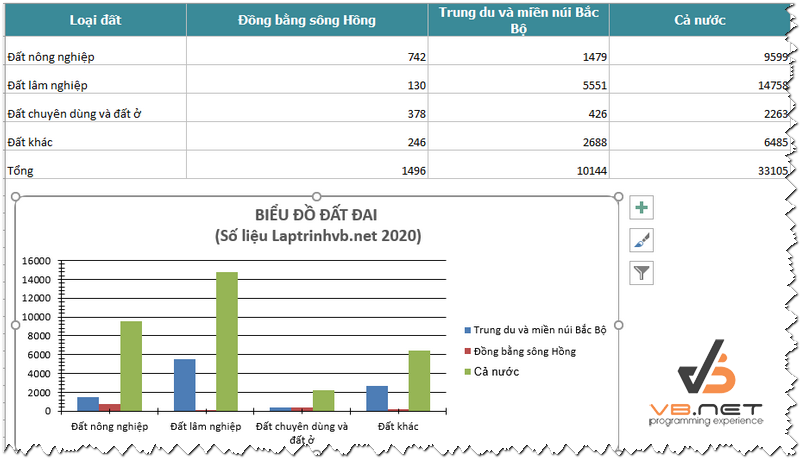
Và bây giờ, mình muốn xuất dữ liệu ra Excel, với dữ liệu này thì vẽ biểu đồ hình cột cho mình.
Dưới đây là kết quả sau khi mình vẽ biểu đồ:
Source code Chart Excel C#:
using OfficeOpenXml;
using OfficeOpenXml.Drawing;
using OfficeOpenXml.Drawing.Chart;
using OfficeOpenXml.Style;
using System;
using System.Collections.Generic;
using System.ComponentModel;
using System.Data;
using System.Diagnostics;
using System.Drawing;
using System.IO;
using System.Linq;
using System.Text;
using System.Threading.Tasks;
using System.Windows.Forms;

namespace ExportChartToExcel
{
    public partial class Form1 : Form
    {
        public Form1()
        {
            InitializeComponent();
        }

        private void btnExport_Click(object sender, EventArgs e)
        {

			FileInfo newFile = new FileInfo(@"chart.xlsx");
			if (newFile.Exists)
			{
				newFile.Delete();
				newFile = new FileInfo(@"chart.xlsx");
			}
			using (ExcelPackage package = new ExcelPackage(newFile))
			{
				ExcelWorksheet worksheet = package.Workbook.Worksheets.Add("test");

				worksheet.Cells.Style.WrapText = true;
				worksheet.View.ShowGridLines = false;//Remove the grid lines of the sheet

				worksheet.Cells[1, 1].Value = "Loại đất";
				worksheet.Cells[1, 2].Value = "Đồng bằng sông Hồng";
				worksheet.Cells[1, 3].Value = "Trung du và miền núi Bắc Bộ";
				worksheet.Cells[1, 4].Value = "Cả nước";

				worksheet.Cells[2, 1].Value = "Đất nông nghiệp";
				worksheet.Cells[2, 2].Value = 742;
				worksheet.Cells[2, 3].Value = 1479;
				worksheet.Cells[2, 4].Value = 9599;

				worksheet.Cells[3, 1].Value = "Đất lâm nghiệp";
				worksheet.Cells[3, 2].Value = 130;
				worksheet.Cells[3, 3].Value = 5551;
				worksheet.Cells[3, 4].Value = 14758;

				worksheet.Cells[4, 1].Value = "Đất chuyên dùng và đất ở";
				worksheet.Cells[4, 2].Value = 378;
				worksheet.Cells[4, 3].Value = 426;
				worksheet.Cells[4, 4].Value = 2263;

				worksheet.Cells[5, 1].Value = "Đất khác";
				worksheet.Cells[5, 2].Value = 246;
				worksheet.Cells[5, 3].Value = 2688;
				worksheet.Cells[5, 4].Value = 6485;

				worksheet.Cells[6, 1].Value = "Tổng";
				worksheet.Cells[6, 2].Value = 1496;
				worksheet.Cells[6, 3].Value = 10144;
				worksheet.Cells[6, 4].Value = 33105;

                using (ExcelRange range = worksheet.Cells[1, 1, 1, 4])
                {
                    range.Style.HorizontalAlignment = ExcelHorizontalAlignment.Center;
                    range.Style.VerticalAlignment = ExcelVerticalAlignment.Center;
                }

                using (ExcelRange range = worksheet.Cells[1, 1, 1, 4])
				{
					range.Style.Font.Bold = true;
					range.Style.Font.Color.SetColor(Color.White);
					range.Style.Font.Name = "Tahoma";
					range.Style.Font.Size = 11;
					range.Style.Fill.PatternType = ExcelFillStyle.Solid;
					range.Style.Fill.BackgroundColor.SetColor(ColorTranslator.FromHtml("#3A8A98"));
				}

				worksheet.Column(1).Width = 30;
				worksheet.Column(2).Width = 40;
				worksheet.Column(3).Width = 30;
				worksheet.Column(4).Width = 30;
				worksheet.Row(5).Height = 25;
				worksheet.Row(2).Height = 25;
				worksheet.Row(3).Height = 25;
				worksheet.Row(4).Height = 25;
				worksheet.Row(6).Height = 25;

				worksheet.Cells[1, 1].Style.Border.BorderAround(ExcelBorderStyle.Thin, Color.FromArgb(191, 191, 191));
				worksheet.Cells[1, 2].Style.Border.BorderAround(ExcelBorderStyle.Thin, Color.FromArgb(191, 191, 191));
				worksheet.Cells[1, 3].Style.Border.BorderAround(ExcelBorderStyle.Thin, Color.FromArgb(191, 191, 191));
				worksheet.Cells[1, 4].Style.Border.BorderAround(ExcelBorderStyle.Thin, Color.FromArgb(191, 191, 191));

				worksheet.Cells[2, 1].Style.Border.BorderAround(ExcelBorderStyle.Thin, Color.FromArgb(191, 191, 191));
				worksheet.Cells[2, 2].Style.Border.BorderAround(ExcelBorderStyle.Thin, Color.FromArgb(191, 191, 191));
				worksheet.Cells[2, 3].Style.Border.BorderAround(ExcelBorderStyle.Thin, Color.FromArgb(191, 191, 191));
				worksheet.Cells[2, 4].Style.Border.BorderAround(ExcelBorderStyle.Thin, Color.FromArgb(191, 191, 191));

				worksheet.Cells[3, 1].Style.Border.BorderAround(ExcelBorderStyle.Thin, Color.FromArgb(191, 191, 191));
				worksheet.Cells[3, 2].Style.Border.BorderAround(ExcelBorderStyle.Thin, Color.FromArgb(191, 191, 191));
				worksheet.Cells[3, 3].Style.Border.BorderAround(ExcelBorderStyle.Thin, Color.FromArgb(191, 191, 191));
				worksheet.Cells[3, 4].Style.Border.BorderAround(ExcelBorderStyle.Thin, Color.FromArgb(191, 191, 191));

				worksheet.Cells[4, 1].Style.Border.BorderAround(ExcelBorderStyle.Thin, Color.FromArgb(191, 191, 191));
				worksheet.Cells[4, 2].Style.Border.BorderAround(ExcelBorderStyle.Thin, Color.FromArgb(191, 191, 191));
				worksheet.Cells[4, 3].Style.Border.BorderAround(ExcelBorderStyle.Thin, Color.FromArgb(191, 191, 191));
				worksheet.Cells[4, 4].Style.Border.BorderAround(ExcelBorderStyle.Thin, Color.FromArgb(191, 191, 191));

				worksheet.Cells[5, 1].Style.Border.BorderAround(ExcelBorderStyle.Thin, Color.FromArgb(191, 191, 191));
				worksheet.Cells[5, 2].Style.Border.BorderAround(ExcelBorderStyle.Thin, Color.FromArgb(191, 191, 191));
				worksheet.Cells[5, 3].Style.Border.BorderAround(ExcelBorderStyle.Thin, Color.FromArgb(191, 191, 191));
				worksheet.Cells[5, 4].Style.Border.BorderAround(ExcelBorderStyle.Thin, Color.FromArgb(191, 191, 191));

				worksheet.Cells[6, 1].Style.Border.BorderAround(ExcelBorderStyle.Thin, Color.FromArgb(191, 191, 191));
				worksheet.Cells[6, 2].Style.Border.BorderAround(ExcelBorderStyle.Thin, Color.FromArgb(191, 191, 191));
				worksheet.Cells[6, 3].Style.Border.BorderAround(ExcelBorderStyle.Thin, Color.FromArgb(191, 191, 191));
				worksheet.Cells[6, 4].Style.Border.BorderAround(ExcelBorderStyle.Thin, Color.FromArgb(191, 191, 191));

				ExcelChart chart = worksheet.Drawings.AddChart("chart", eChartType.ColumnClustered);

				ExcelChartSerie serie = chart.Series.Add(worksheet.Cells[2, 3, 5, 3], worksheet.Cells[2, 1, 5, 1]);
				ExcelChartSerie serie1 = chart.Series.Add(worksheet.Cells[2, 2, 5, 2], worksheet.Cells[2, 1, 5, 1]);
				ExcelChartSerie serie2 = chart.Series.Add(worksheet.Cells[2, 4, 5, 4], worksheet.Cells[2, 1, 5, 1]);
				serie.HeaderAddress = worksheet.Cells[1, 3];
				serie1.HeaderAddress = worksheet.Cells[1, 2];
				serie2.HeaderAddress = worksheet.Cells[1, 4];
				serie.Fill.Color = ColorTranslator.FromHtml("#4D7DB6");
				serie1.Fill.Color = ColorTranslator.FromHtml("#BA4D4C");
				serie2.Fill.Color = ColorTranslator.FromHtml("#96B555");

				chart.SetPosition(250, 10);
				chart.SetSize(700, 300);
				chart.Title.Text = "BIỂU ĐỒ ĐẤT ĐAI \r\n (Số liệu Laptrinhvb.net 2020)";

				chart.Title.Font.Color = Color.FromArgb(89, 89, 89);
				chart.Title.Font.Size = 15;
				chart.Title.Font.Bold = true;

				chart.Style = eChartStyle.Style8;

				chart.RoundedCorners = true;
				chart.Legend.Border.LineStyle = eLineStyle.Solid;

				//chart.Legend.Border.Fill.Color = Color.

				package.Save();
				Process.Start("chart.xlsx");
			}

		}
	}
}
Thanks for watching!
THÔNG TIN TÁC GIẢ
NGUYỄN THẢO
Youtube Channel: https://www.youtube.com/@thaomeotv

BÀI VIẾT LIÊN QUAN
Đăng bởi: Thảo Meo - Lượt xem: 7606