- KHI SỰ TINH GIẢN LÀ ĐỈNH CAO CỦA CÔNG NGHỆ BÁN HÀNG 2026 - PHẦN MỀM BÁN HÀNG BASYS
- Phần mềm bán hàng cho hộ kinh doanh BASYS đơn giản ít thao tác
- [C#] Hướng dẫn tích hợp thêm menu vào System menu của ứng dụng
- [DEVEXPRESS] Hỗ trợ tìm kiếm highlight không dấu và không khoảng cách trên Gridview Filter
- [C#] Chia sẻ source code phần mềm Image Downloader tải hàng loạt hình ảnh từ danh sách link url
- [C#] Chụp hình và quay video từ camera trên winform
- [C#] Chia sẽ full source code tách file Pdf thành nhiều file với các tùy chọn
- Giới thiệu về Stock Tracker Widget - Công cụ theo dõi cổ phiếu và cảnh báo giá tăng giảm bằng C# và WPF
- [VB.NET] Chia sẻ công cụ nhập số tiền tự động định dạng tiền tệ Việt Nam
- [VB.NET] Hướng dẫn fill dữ liệu từ winform vào Microsoft word
- [VB.NET] Hướng dẫn chọn nhiều dòng trên Datagridview
- Hướng Dẫn Đăng Nhập Nhiều Tài Khoản Zalo Trên Máy Tính Cực Kỳ Đơn Giản
- [C#] Chia sẻ source code phần mềm đếm số trang tập tin file PDF
- [C#] Cách Sử Dụng DeviceId trong C# Để Tạo Khóa Cho Ứng Dụng
- [SQLSERVER] Loại bỏ Restricted User trên database MSSQL
- [C#] Hướng dẫn tạo mã QRcode Style trên winform
- [C#] Hướng dẫn sử dụng temp mail service api trên winform
- [C#] Hướng dẫn tạo mã thanh toán VietQR Pay không sử dụng API trên winform
- [C#] Hướng Dẫn Tạo Windows Service Đơn Giản Bằng Topshelf
- [C#] Chia sẻ source code đọc dữ liệu từ Google Sheet trên winform
[REPORT CHART] Hướng dẫn vẽ biểu đồ Chart Pie trong winform và xtra report của Devexpress
Hôm nay, mình xin hướng dẫn các bạn, cách sử dụng chart control trong bộ công cụ devexpress.
Devexpress cung cấp cho chúng ta một thư viện biểu đồ khá phong phú: gồm rất nhiều loại biểu đồ phổ biến
- Biểu đồ pie (hình tròn)
- Biểu đồ line
- Biểu đồ Column
- Biểu đồ Grantt...
Đầu tiên, mình sẽ chỉ cho các bạn cách vẽ biểu đồ chart bằng datatable, các bạn cũng có thể sử dụng dataset. Sử dụng datatable load trực tiếp từ cơ sở dữ liệu, sẽ làm cho biểu đồ linh động hơn là chúng ta sử dụng công cụ tự động của bộ devexpress.
Sau khi vẽ biểu đồ được trên winform, mình sẽ hướng dẫn các bạn tiếp tục in biểu đồ chart qua xtra report.
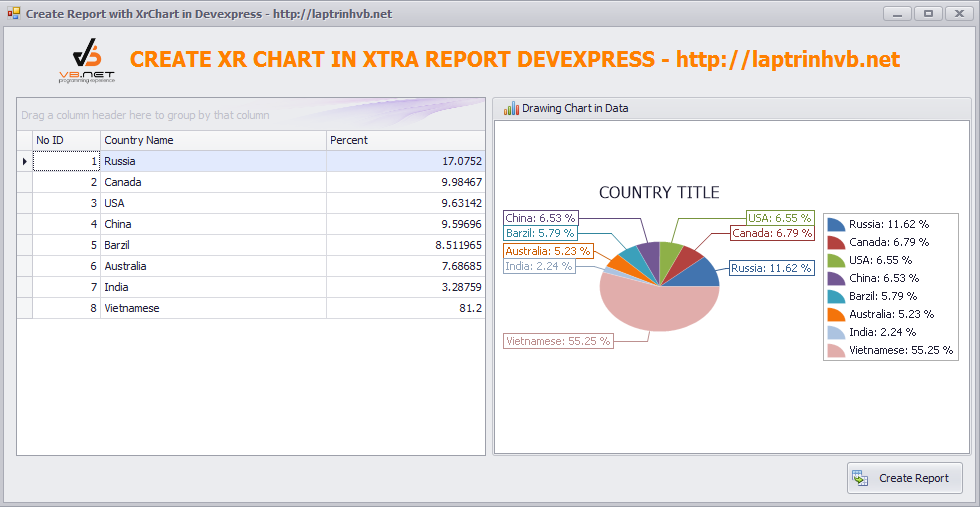
Giao diện chương trình của ứng dụng:

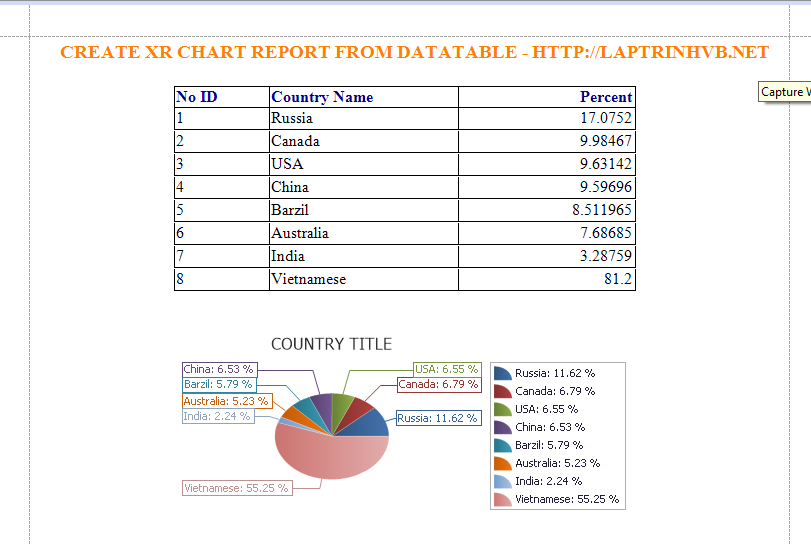
Sau khi, các bạn click chọn vào nút tạo report chúng ta sẽ được một report như hình bên dưới:

Dưới đây là code của chương trình:
- Đầu tiên, là code trong chương trình Form1
Imports DevExpress.XtraCharts
Imports System.Data
Imports System.Data.SqlClient


Partial Public Class Form1
    Inherits DevExpress.XtraEditors.XtraForm
    Shared Sub New()
        DevExpress.UserSkins.BonusSkins.Register()
        DevExpress.Skins.SkinManager.EnableFormSkins()
    End Sub
    Public Sub New()
        InitializeComponent()
    End Sub
    Dim con As New SqlConnection
    Public Sub Taoketnoi()
        Dim str As String = "Data Source=.;Initial Catalog=batdongsan;Integrated Security=True"
        con.ConnectionString = str
        con.Open()
    End Sub
    Public Function LayDulieu() As DataTable
        Taoketnoi()
        Dim dt As New DataTable
        Dim da As New SqlDataAdapter
        da.SelectCommand = New SqlCommand("select * from tbl_country", con)
        da.Fill(dt)
        con.Close()
        Return dt
    End Function
    Private Sub Form1_Load(sender As Object, e As EventArgs) Handles MyBase.Load
        Dim dt As New DataTable
        dt = LayDulieu()
        GridControl1.DataSource = dt
        Dim pieChart As New ChartControl()
        Dim series1 As New Series("COUNTRY TITLE ", ViewType.Pie)
        For Each dr As DataRow In dt.Rows
            series1.Points.Add(New SeriesPoint(dr("countryname"), dr("percent")))
        Next
        pieChart.Series.Add(series1)
        series1.Label.TextPattern = "{A}: {VP:p2}"
        CType(series1.Label, PieSeriesLabel).Position = PieSeriesLabelPosition.TwoColumns
        CType(series1.Label, PieSeriesLabel).ResolveOverlappingMode = ResolveOverlappingMode.Default
        Dim myView As PieSeriesView = CType(series1.View, PieSeriesView)
        myView.Titles.Add(New SeriesTitle())
        myView.Titles(0).Text = series1.Name
        myView.ExplodeMode = PieExplodeMode.UseFilters
        myView.ExplodedDistancePercentage = 30
        myView.RuntimeExploding = True
        myView.HeightToWidthRatio = 0.75
        pieChart.Legend.Visibility = DevExpress.Utils.DefaultBoolean.True
        pieChart.Legend.AlignmentVertical = LegendAlignmentVertical.Center
        pieChart.Dock = DockStyle.Fill
        GroupControl1.Controls.Add(pieChart)
    End Sub

    Private Sub btncreate_Click(sender As Object, e As EventArgs) Handles btncreate.Click
        Dim dt As New DataTable
        dt = LayDulieu()
        Dim rpt As New XtraReport1
        Dim series1 As New Series("COUNTRY TITLE ", ViewType.Pie)
        For Each dr As DataRow In dt.Rows
            series1.Points.Add(New SeriesPoint(dr("countryname"), dr("percent")))
        Next
        rpt.XrChart1.Series.Add(series1)
        series1.Label.TextPattern = "{A}: {VP:p2}"
        CType(series1.Label, PieSeriesLabel).Position = PieSeriesLabelPosition.TwoColumns
        CType(series1.Label, PieSeriesLabel).ResolveOverlappingMode = ResolveOverlappingMode.Default
        Dim myView As PieSeriesView = CType(series1.View, PieSeriesView)
        myView.Titles.Add(New SeriesTitle())
        myView.Titles(0).Text = series1.Name
        myView.ExplodeMode = PieExplodeMode.UseFilters
        myView.ExplodedDistancePercentage = 30
        myView.RuntimeExploding = True
        myView.HeightToWidthRatio = 0.75
        rpt.XrChart1.Legend.Visibility = DevExpress.Utils.DefaultBoolean.True
        rpt.XrChart1.Legend.AlignmentVertical = LegendAlignmentVertical.Center
        rpt.DataSource = dt
        rpt.BindData()
        Dim frm As New XtraForm1
        frm.DocumentViewer1.PrintingSystem = rpt.PrintingSystem
        rpt.CreateDocument()
        frm.Show()
    End Sub
End Class
- Tiếp tục, các bạn code cho xtraReport1
Imports System.Data
Imports DevExpress.XtraCharts
Public Class XtraReport1
    Public Sub BindData()
        lblid.DataBindings.Add("Text", DataSource, "id")
        lblcountry.DataBindings.Add("Text", DataSource, "countryname")
        lblpercent.DataBindings.Add("Text", DataSource, "percent")
        XrChart1.DataBindings.Add("Text", DataSource, "percent")
    End Sub
End Class
- Tiếp theo, mình sẽ tạo một form: các bạn chèn công cụ Document Viewer vào để show report
Video Demo ứng dụng:
DOWNLOAD SOURCE CODE CHART IN REPORT
Chúc các bạn thành công. Mọi câu hỏi thắc mắc đến bài viết xin truy cập http://hoidap.laptrinhvb.net để được support.
ĐỪNG QUÊN LIKE AND SHARE NHA CÁC BẠN.
CÁM ƠN CÁC BẠN ĐÃ THEO DÕI.


