NEWS
- Phần mềm làm mờ tin nhắn Zalo PC trên Desktop - Bảo mật và chống nhìn trộm - Chặn đang soạn tin nhắn
- KHI SỰ TINH GIẢN LÀ ĐỈNH CAO CỦA CÔNG NGHỆ BÁN HÀNG 2026 - PHẦN MỀM BÁN HÀNG BASYS
- Phần mềm bán hàng cho hộ kinh doanh BASYS đơn giản ít thao tác
- [C#] Hướng dẫn tích hợp thêm menu vào System menu của ứng dụng
- [DEVEXPRESS] Hỗ trợ tìm kiếm highlight không dấu và không khoảng cách trên Gridview Filter
- [C#] Chia sẻ source code phần mềm Image Downloader tải hàng loạt hình ảnh từ danh sách link url
- [C#] Chụp hình và quay video từ camera trên winform
- [C#] Chia sẽ full source code tách file Pdf thành nhiều file với các tùy chọn
- Giới thiệu về Stock Tracker Widget - Công cụ theo dõi cổ phiếu và cảnh báo giá tăng giảm bằng C# và WPF
- [VB.NET] Chia sẻ công cụ nhập số tiền tự động định dạng tiền tệ Việt Nam
- [VB.NET] Hướng dẫn fill dữ liệu từ winform vào Microsoft word
- [VB.NET] Hướng dẫn chọn nhiều dòng trên Datagridview
- Hướng Dẫn Đăng Nhập Nhiều Tài Khoản Zalo Trên Máy Tính Cực Kỳ Đơn Giản
- [C#] Chia sẻ source code phần mềm đếm số trang tập tin file PDF
- [C#] Cách Sử Dụng DeviceId trong C# Để Tạo Khóa Cho Ứng Dụng
- [SQLSERVER] Loại bỏ Restricted User trên database MSSQL
- [C#] Hướng dẫn tạo mã QRcode Style trên winform
- [C#] Hướng dẫn sử dụng temp mail service api trên winform
- [C#] Hướng dẫn tạo mã thanh toán VietQR Pay không sử dụng API trên winform
- [C#] Hướng Dẫn Tạo Windows Service Đơn Giản Bằng Topshelf
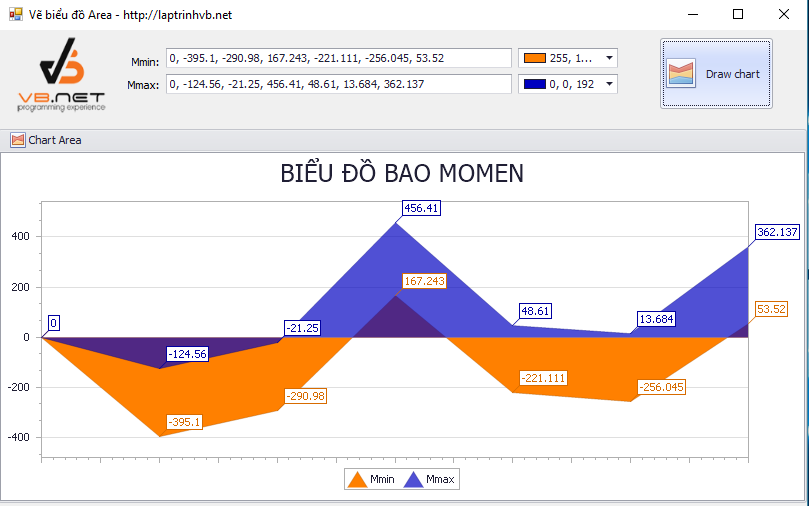
Hướng dẫn vẽ biểu đồ vùng (chart area) in Devexpress
Đăng bởi: Thảo Meo - Lượt xem: 15769
Hôm nay, mình xin tiếp tục hướng dẫn các bạn vẽ biểu đồ vùng (Chart Area) trong bộ công cụ Chart Control của Devexpress.
Các bạn, có thể tham khảo các bài viết vẽ biểu đồ khác mình đã post trước đó.
Giao diện ứng dụng vẽ biểu đồ vùng:
Source code ứng dụng:
Imports System
Imports System.Text.RegularExpressions
Imports System.Windows.Forms
Imports DevExpress.XtraCharts
Namespace Series_AreaChart
    Partial Public Class Form1
        Inherits Form
        Public Sub New()
            InitializeComponent()
        End Sub
        Dim strArr_mmin() As String
        Dim strArr_mmax() As String
        Private Sub btndraw_Click(sender As Object, e As EventArgs) Handles btndraw.Click
            GroupControl1.Controls.Clear()
            'Khai báo biến
            Dim chart As New ChartControl
            Dim mmin As String = txtmmin.Text
            Dim mmax As String = txtmmax.Text

            strArr_mmin = Regex.Split(mmin, ",")
            strArr_mmax = Regex.Split(mmax, ",")
            'Khai báo biến area
            Dim series1 As New Series("Mmin", ViewType.Area)
            Dim series2 As New Series("Mmax", ViewType.Area)
            'Tạo serial mmin
            For count = 0 To strArr_mmin.Length - 1
                series1.Points.Add(New SeriesPoint(count, strArr_mmin(count)))
            Next
            'Tạo serial mmax
            For count2 = 0 To strArr_mmax.Length - 1
                series2.Points.Add(New SeriesPoint(count2, strArr_mmax(count2)))
            Next
            ' hiển thị label (số liệu trên biểu đồ)
            series1.LabelsVisibility = DevExpress.Utils.DefaultBoolean.True
            'đặt màu cho biểu đồ mmin
            series1.View.Color = color_mmin.Color
            'đặt màu cho biểu đồ mmax
            series2.View.Color = color_mmax.Color
            series2.LabelsVisibility = DevExpress.Utils.DefaultBoolean.True
            ' Thêm 2 series vào biểu đồ
            chart.Series.AddRange(New Series() {series1, series2})
            Dim diagram As XYDiagram = TryCast(chart.Diagram, XYDiagram)

            series1.ArgumentScaleType = ScaleType.Numerical
            series2.ArgumentScaleType = ScaleType.Numerical
            'Làm mờ màu đường serial 2
            CType(series2.View, AreaSeriesView).Transparency = 80

            ' Ẩn đường Y dưới biểu đồ
            CType(chart.Diagram, XYDiagram).AxisX.Label.Visible = False
            ' Tạo chi chú legend cho biểu đồ
            chart.Legend.Visibility = DevExpress.Utils.DefaultBoolean.True
            chart.Legend.AlignmentHorizontal = LegendAlignmentHorizontal.Center
            chart.Legend.AlignmentVertical = LegendAlignmentVertical.BottomOutside
            chart.Legend.Direction = LegendDirection.LeftToRight
            ' Tạo tiêu đề cho biểu đồ
            chart.Titles.Add(New ChartTitle())
            chart.Titles(0).Text = "BIỂU ĐỒ BAO MOMEN"

            GroupControl1.Controls.Add(chart)
            chart.Dock = DockStyle.Fill
        End Sub

        Private Sub Form1_Load(sender As Object, e As EventArgs) Handles MyBase.Load
            'TODO: This line of code loads data into the 'HOB2016DataSet.tbl_thongtin' table. You can move, or remove it, as needed.
            Me.Tbl_thongtinTableAdapter.Fill(Me.HOB2016DataSet.tbl_thongtin)

        End Sub
    End Class
End Namespace
CHÚC CÁC BẠN THÀNH CÔNG!
THÔNG TIN TÁC GIẢ
NGUYỄN THẢO
Youtube Channel: https://www.youtube.com/@thaomeotv

BÀI VIẾT LIÊN QUAN
Đăng bởi: Thảo Meo - Lượt xem: 15769