NEWS
- Phần mềm làm mờ tin nhắn Zalo PC trên Desktop - Bảo mật và chống nhìn trộm - Chặn đang soạn tin nhắn
- KHI SỰ TINH GIẢN LÀ ĐỈNH CAO CỦA CÔNG NGHỆ BÁN HÀNG 2026 - PHẦN MỀM BÁN HÀNG BASYS
- Phần mềm bán hàng cho hộ kinh doanh BASYS đơn giản ít thao tác
- [C#] Hướng dẫn tích hợp thêm menu vào System menu của ứng dụng
- [DEVEXPRESS] Hỗ trợ tìm kiếm highlight không dấu và không khoảng cách trên Gridview Filter
- [C#] Chia sẻ source code phần mềm Image Downloader tải hàng loạt hình ảnh từ danh sách link url
- [C#] Chụp hình và quay video từ camera trên winform
- [C#] Chia sẽ full source code tách file Pdf thành nhiều file với các tùy chọn
- Giới thiệu về Stock Tracker Widget - Công cụ theo dõi cổ phiếu và cảnh báo giá tăng giảm bằng C# và WPF
- [VB.NET] Chia sẻ công cụ nhập số tiền tự động định dạng tiền tệ Việt Nam
- [VB.NET] Hướng dẫn fill dữ liệu từ winform vào Microsoft word
- [VB.NET] Hướng dẫn chọn nhiều dòng trên Datagridview
- Hướng Dẫn Đăng Nhập Nhiều Tài Khoản Zalo Trên Máy Tính Cực Kỳ Đơn Giản
- [C#] Chia sẻ source code phần mềm đếm số trang tập tin file PDF
- [C#] Cách Sử Dụng DeviceId trong C# Để Tạo Khóa Cho Ứng Dụng
- [SQLSERVER] Loại bỏ Restricted User trên database MSSQL
- [C#] Hướng dẫn tạo mã QRcode Style trên winform
- [C#] Hướng dẫn sử dụng temp mail service api trên winform
- [C#] Hướng dẫn tạo mã thanh toán VietQR Pay không sử dụng API trên winform
- [C#] Hướng Dẫn Tạo Windows Service Đơn Giản Bằng Topshelf
[C#] Sử dụng thư viện ZedGraph vẽ biểu đồ Line, Bar, Pie trên Winform
Đăng bởi: Thảo Meo - Lượt xem: 14751
ZedGraph là thư viện dùng để vẽ biểu đồ: Bar chart, Line Chart, và Pie Chart 2D trên lập trình ngôn ngữ C#, Winform.
[C#] Draw Chart with Library ZedGraph
Nếu bạn không có sử dụng Devexpress, thì có thể sử dụng bộ thư viện này để thay thế.
Bạn có thể dễ dàng cài đặt thư viện này từ Nuget. Phiên bản hiện tại là: ZedGraph 6.0.0-alpha0001 Support Net FrameWork Standard 2.0
PM> Install-Package ZedGraph -Version 6.0.0-alpha0001Sau khi cài đặt xong, các bạn sử dụng control ZedGraphControl để sử dụng vào winform.
1. Tạo data mẫu Sample
private Random rand = new Random(0);
private double[] RandomWalk(int points = 5, double start = 100, double mult = 50)
{
    // return an array of difting random numbers
    double[] values = new double[points];
    values[0] = start;
    for (int i = 1; i < points; i++)
        values[i] = values[i - 1] + (rand.NextDouble() - .5) * mult;
    return values;
}
2. Biểu đồ Bar Graph
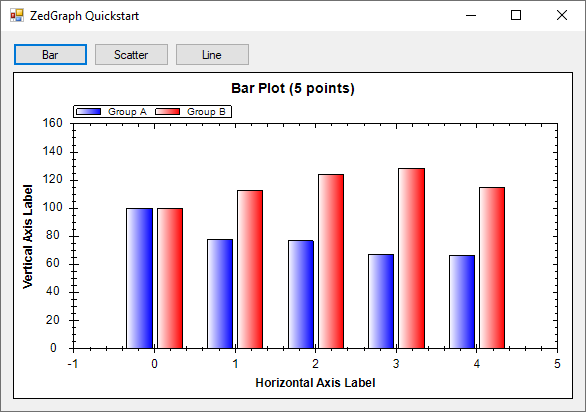
// generate some random Y data
int pointCount = 5;
double[] xs = Consecutive(pointCount);
double[] ys1 = RandomWalk(pointCount);
double[] ys2 = RandomWalk(pointCount);

// clear old curves
zedGraphControl1.GraphPane.CurveList.Clear();

// plot the data as bars
zedGraphControl1.GraphPane.AddBar("Group A", xs, ys1, Color.Blue);
zedGraphControl1.GraphPane.AddBar("Group B", xs, ys2, Color.Red);

// style the plot
zedGraphControl1.GraphPane.Title.Text = $"Bar Plot ({pointCount:n0} points)";
zedGraphControl1.GraphPane.XAxis.Title.Text = "Horizontal Axis Label";
zedGraphControl1.GraphPane.YAxis.Title.Text = "Vertical Axis Label";

// auto-axis and update the display
zedGraphControl1.GraphPane.XAxis.ResetAutoScale(zedGraphControl1.GraphPane, CreateGraphics());
zedGraphControl1.GraphPane.YAxis.ResetAutoScale(zedGraphControl1.GraphPane, CreateGraphics());
zedGraphControl1.Refresh();
3. Biểu đồ Scatter Plot
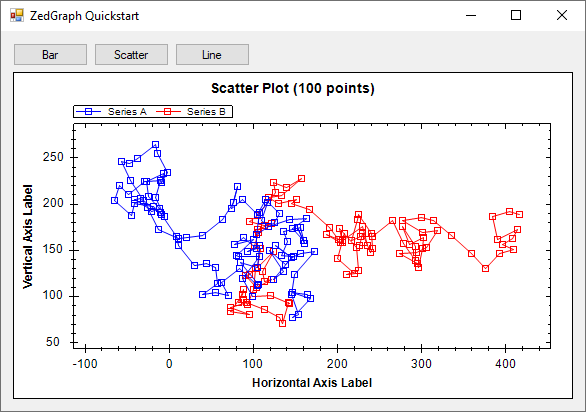
// generate some random Y data
int pointCount = 100;
double[] xs1 = RandomWalk(pointCount);
double[] ys1 = RandomWalk(pointCount);
double[] xs2 = RandomWalk(pointCount);
double[] ys2 = RandomWalk(pointCount);

// clear old curves
zedGraphControl1.GraphPane.CurveList.Clear();

// plot the data as curves
var curve1 = zedGraphControl1.GraphPane.AddCurve("Series A", xs1, ys1, Color.Blue);
curve1.Line.IsAntiAlias = true;

var curve2 = zedGraphControl1.GraphPane.AddCurve("Series B", xs2, ys2, Color.Red);
curve2.Line.IsAntiAlias = true;

// style the plot
zedGraphControl1.GraphPane.Title.Text = $"Scatter Plot ({pointCount:n0} points)";
zedGraphControl1.GraphPane.XAxis.Title.Text = "Horizontal Axis Label";
zedGraphControl1.GraphPane.YAxis.Title.Text = "Vertical Axis Label";

// auto-axis and update the display
zedGraphControl1.GraphPane.XAxis.ResetAutoScale(zedGraphControl1.GraphPane, CreateGraphics());
zedGraphControl1.GraphPane.YAxis.ResetAutoScale(zedGraphControl1.GraphPane, CreateGraphics());
zedGraphControl1.Refresh();
4. Biểu đồ Line Graph
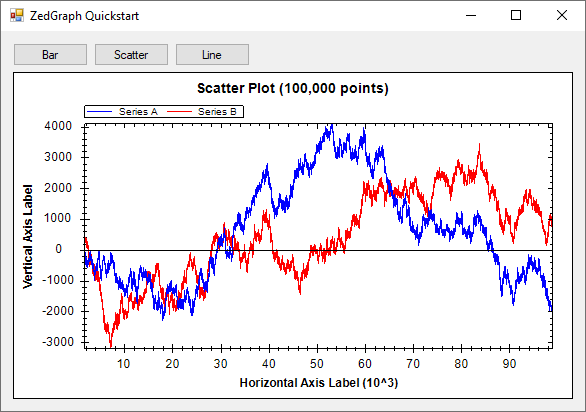
// generate some random Y data
int pointCount = 100_000;
double[] xs = Consecutive(pointCount);
double[] ys1 = RandomWalk(pointCount);
double[] ys2 = RandomWalk(pointCount);

// clear old curves
zedGraphControl1.GraphPane.CurveList.Clear();

// plot the data as curves
var curve1 = zedGraphControl1.GraphPane.AddCurve("Series A", xs, ys1, Color.Blue);
curve1.Line.IsAntiAlias = true;
curve1.Symbol.IsVisible = false;

var curve2 = zedGraphControl1.GraphPane.AddCurve("Series B", xs, ys2, Color.Red);
curve2.Line.IsAntiAlias = true;
curve2.Symbol.IsVisible = false;

// style the plot
zedGraphControl1.GraphPane.Title.Text = $"Scatter Plot ({pointCount:n0} points)";
zedGraphControl1.GraphPane.XAxis.Title.Text = "Horizontal Axis Label";
zedGraphControl1.GraphPane.YAxis.Title.Text = "Vertical Axis Label";

// auto-axis and update the display
zedGraphControl1.GraphPane.XAxis.ResetAutoScale(zedGraphControl1.GraphPane, CreateGraphics());
zedGraphControl1.GraphPane.YAxis.ResetAutoScale(zedGraphControl1.GraphPane, CreateGraphics());
zedGraphControl1.Refresh();
5. Biểu đồ Multiple Y Axes
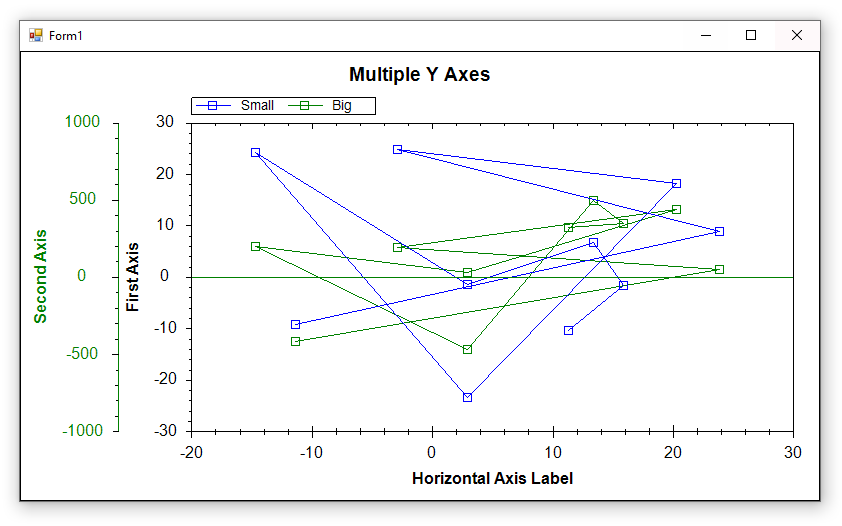
// generate some random Y data
int pointCount = 10;
double[] xs = Random(pointCount);
double[] ys1 = Random(pointCount);
double[] ys2 = Random(pointCount, 0, 1000);

// clear old curves
zedGraphControl1.GraphPane.CurveList.Clear();

// clear old Y axes and manually add new ones
zedGraphControl1.GraphPane.YAxisList.Clear();

// add a traditional Y axis
zedGraphControl1.GraphPane.AddYAxis("First Axis");
var firstAxis = zedGraphControl1.GraphPane.YAxisList[0];
firstAxis.Color = Color.Blue;

// create another Y axis and customize it
zedGraphControl1.GraphPane.AddYAxis("Second Axis");
var secondAxis = zedGraphControl1.GraphPane.YAxisList[1];
secondAxis.Scale.Max = 1000;
secondAxis.Scale.Min = -1000;
secondAxis.Scale.FontSpec.FontColor = Color.Green;
secondAxis.Title.FontSpec.FontColor = Color.Green;
secondAxis.Color = Color.Green;

// plot the data as curves
var curve1 = zedGraphControl1.GraphPane.AddCurve("Small", xs, ys1, Color.Blue);
var curve2 = zedGraphControl1.GraphPane.AddCurve("Big", xs, ys2, Color.Green);

// specify which curve is to use which axis
curve1.YAxisIndex = 0;
curve2.YAxisIndex = 1;

// style the plot
zedGraphControl1.GraphPane.Title.Text = $"Multiple Y Axes";
zedGraphControl1.GraphPane.XAxis.Title.Text = "Horizontal Axis Label";

// auto-axis and update the display
zedGraphControl1.GraphPane.XAxis.ResetAutoScale(zedGraphControl1.GraphPane, CreateGraphics());
zedGraphControl1.GraphPane.YAxis.ResetAutoScale(zedGraphControl1.GraphPane, CreateGraphics());
zedGraphControl1.Refresh();
Thanks for waching!
THÔNG TIN TÁC GIẢ
NGUYỄN THẢO
Youtube Channel: https://www.youtube.com/@thaomeotv

BÀI VIẾT LIÊN QUAN
Đăng bởi: Thảo Meo - Lượt xem: 14751