NEWS
- KHI SỰ TINH GIẢN LÀ ĐỈNH CAO CỦA CÔNG NGHỆ BÁN HÀNG 2026 - PHẦN MỀM BÁN HÀNG BASYS
- Phần mềm bán hàng cho hộ kinh doanh BASYS đơn giản ít thao tác
- [C#] Hướng dẫn tích hợp thêm menu vào System menu của ứng dụng
- [DEVEXPRESS] Hỗ trợ tìm kiếm highlight không dấu và không khoảng cách trên Gridview Filter
- [C#] Chia sẻ source code phần mềm Image Downloader tải hàng loạt hình ảnh từ danh sách link url
- [C#] Chụp hình và quay video từ camera trên winform
- [C#] Chia sẽ full source code tách file Pdf thành nhiều file với các tùy chọn
- Giới thiệu về Stock Tracker Widget - Công cụ theo dõi cổ phiếu và cảnh báo giá tăng giảm bằng C# và WPF
- [VB.NET] Chia sẻ công cụ nhập số tiền tự động định dạng tiền tệ Việt Nam
- [VB.NET] Hướng dẫn fill dữ liệu từ winform vào Microsoft word
- [VB.NET] Hướng dẫn chọn nhiều dòng trên Datagridview
- Hướng Dẫn Đăng Nhập Nhiều Tài Khoản Zalo Trên Máy Tính Cực Kỳ Đơn Giản
- [C#] Chia sẻ source code phần mềm đếm số trang tập tin file PDF
- [C#] Cách Sử Dụng DeviceId trong C# Để Tạo Khóa Cho Ứng Dụng
- [SQLSERVER] Loại bỏ Restricted User trên database MSSQL
- [C#] Hướng dẫn tạo mã QRcode Style trên winform
- [C#] Hướng dẫn sử dụng temp mail service api trên winform
- [C#] Hướng dẫn tạo mã thanh toán VietQR Pay không sử dụng API trên winform
- [C#] Hướng Dẫn Tạo Windows Service Đơn Giản Bằng Topshelf
- [C#] Chia sẻ source code đọc dữ liệu từ Google Sheet trên winform
[DEVEXPRESS] Vẽ Biểu Đồ Stock Chứng Khoán - Công Cụ Thiết Yếu Cho Nhà Đầu Tư trên Winform
Đăng bởi: Thảo Meo - Lượt xem: 3701
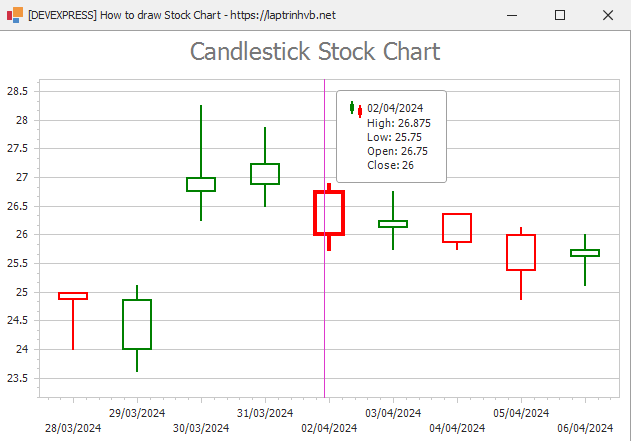
Xin chào các bạn, bài viết hôm nay mình tiếp tục hướng dẫn các bạn vẽ biểu đồ Candlestick Chart của Devexpress C# Winform.
[DEVEXPRESS] How to draw Candlestick chart in C# winform
Biểu đồ stock là công cụ vô cùng quan trọng đối với các nhà đầu tư chứng khoán.
Chúng cung cấp một cái nhìn tổng quan về diễn biến giá cổ phiếu theo thời gian, giúp nhà đầu tư đưa ra các quyết định đầu tư dựa trên phân tích kỹ thuật.
Trong bài viết này, chúng ta sẽ tìm hiểu về các loại biểu đồ stock phổ biến và cách đọc chúng.
Biểu Đồ Nến (Candlestick Chart)
Biểu đồ nến là loại biểu đồ phổ biến nhất trong phân tích kỹ thuật. Chúng thể hiện giá mở cửa, giá cao nhất, giá thấp nhất và giá đóng cửa trong một phiên giao dịch dưới dạng những cây nến. Màu của cây nến cho biết cổ phiếu tăng hay giảm giá trong phiên đó.
Full Source code C#:
using DevExpress.XtraCharts;
using System;
using System.Collections.Generic;
using System.ComponentModel;
using System.Data;
using System.Drawing;
using System.Linq;
using System.Text;
using System.Windows.Forms;

namespace StockChartDemo
{
    public partial class Form1 : DevExpress.XtraEditors.XtraForm
    {
        public Form1()
        {
            InitializeComponent();
        }

        private void Form1_Load(object sender, EventArgs e)
        {
            CreateChart();
        }


        private void CreateChart()
        {
            ChartControl candlestickChart = new ChartControl();

            Series series1 = new Series("Series 1", ViewType.CandleStick);

            series1.DataSource = GetDataPoints();
            series1.SetFinancialDataMembers("Argument", "Low", "High", "Open", "Close");

            series1.ArgumentScaleType = ScaleType.DateTime;

            candlestickChart.Series.Add(series1);

            CandleStickSeriesView view = (CandleStickSeriesView)series1.View;

            view.LineThickness = 2;
            view.LevelLineLength = 0.25;

            view.ReductionOptions.ColorMode = ReductionColorMode.OpenToCloseValue;
            view.ReductionOptions.FillMode = CandleStickFillMode.AlwaysEmpty;
            view.ReductionOptions.Level = StockLevel.Close;
            view.ReductionOptions.Visible = true;

            view.Color = Color.Green;
            view.ReductionOptions.Color = Color.Red;

            XYDiagram diagram = (XYDiagram)candlestickChart.Diagram;

            diagram.AxisX.DateTimeScaleOptions.SkipRangesWithoutPoints = true;

            diagram.AxisY.WholeRange.AlwaysShowZeroLevel = false;

            candlestickChart.Legend.Visibility = DevExpress.Utils.DefaultBoolean.False;

            candlestickChart.Titles.Add(new ChartTitle());
            candlestickChart.Titles[0].Text = "Candlestick Stock Chart";

            candlestickChart.Dock = DockStyle.Fill;
            this.Controls.Add(candlestickChart);
        }

        List<DataPoint> GetDataPoints()
        {
            List<DataPoint> dataPoints = new List<DataPoint> {
            new DataPoint(DateTime.Now.AddDays(-9), 24.00, 25.00, 25.00, 24.875),
            new DataPoint(DateTime.Now.AddDays(-8), 23.625, 25.125, 24.00, 24.875),
            new DataPoint(DateTime.Now.AddDays(-7), 26.25, 28.25, 26.75, 27.00),
            new DataPoint(DateTime.Now.AddDays(-6), 26.50, 27.875, 26.875, 27.25),

            new DataPoint(DateTime.Now.AddDays(-4), 25.75, 26.875, 26.75, 26.00),
            new DataPoint(DateTime.Now.AddDays(-3), 25.75, 26.75, 26.125, 26.25),
            new DataPoint(DateTime.Now.AddDays(-2), 25.75, 26.375, 26.375, 25.875),
            new DataPoint(DateTime.Now.AddDays(-1), 24.875, 26.125, 26.00, 25.375),
            new DataPoint(DateTime.Now.AddDays(0), 25.125, 26.00, 25.625, 25.75),
            };
            return dataPoints;

        }

    }
    public class DataPoint
    {
        public DateTime Argument { get; set; }
        public double Low { get; set; }
        public double High { get; set; }
        public double Open { get; set; }
        public double Close { get; set; }
        public DataPoint(DateTime arg, double low, double high, double open, double close)
        {
            this.Argument = arg;
            this.Low = low;
            this.High = high;
            this.Open = open;
            this.Close = close;
        }
    }
}
Thanks for watching!
THÔNG TIN TÁC GIẢ
NGUYỄN THẢO
Youtube Channel: https://www.youtube.com/@thaomeotv

BÀI VIẾT LIÊN QUAN
Đăng bởi: Thảo Meo - Lượt xem: 3701